

What are Candlesticks? How to Read Candlestick Charts (Beginners Guide)
If you’re new to the stock market, you might have heard traders talk about “bullish candles,” “doji patterns,” or “candlestick analysis.” Candlesticks is one of the first steps to learn tech analysis. Whether you are an intraday trader or swing trader or BTST trader, candlestick charts can help you understand market sentiment and take informed trading decisions.
In this guide we will look at what candlesticks are, how they work and why candlesticks are important to traders.
What is a candelstick?
A candlestick is a graphical display of price action of a financial instrument over a particular period of time. It gives four pieces of vital information:
- Opening Price
- Last Price
- The costliest
- Lowest Price
In fact, candlestick charts were first invented in the 1700s in Japan when rice traders used them to analyze price movements. Now they are used extensively in stock markets throughout the world.
Each candlestick contains a lot of information about the battle between buyers and sellers for a certain period of time.
How to Build a Candlestick
Candles consist of two parts:
1. Body 1.1
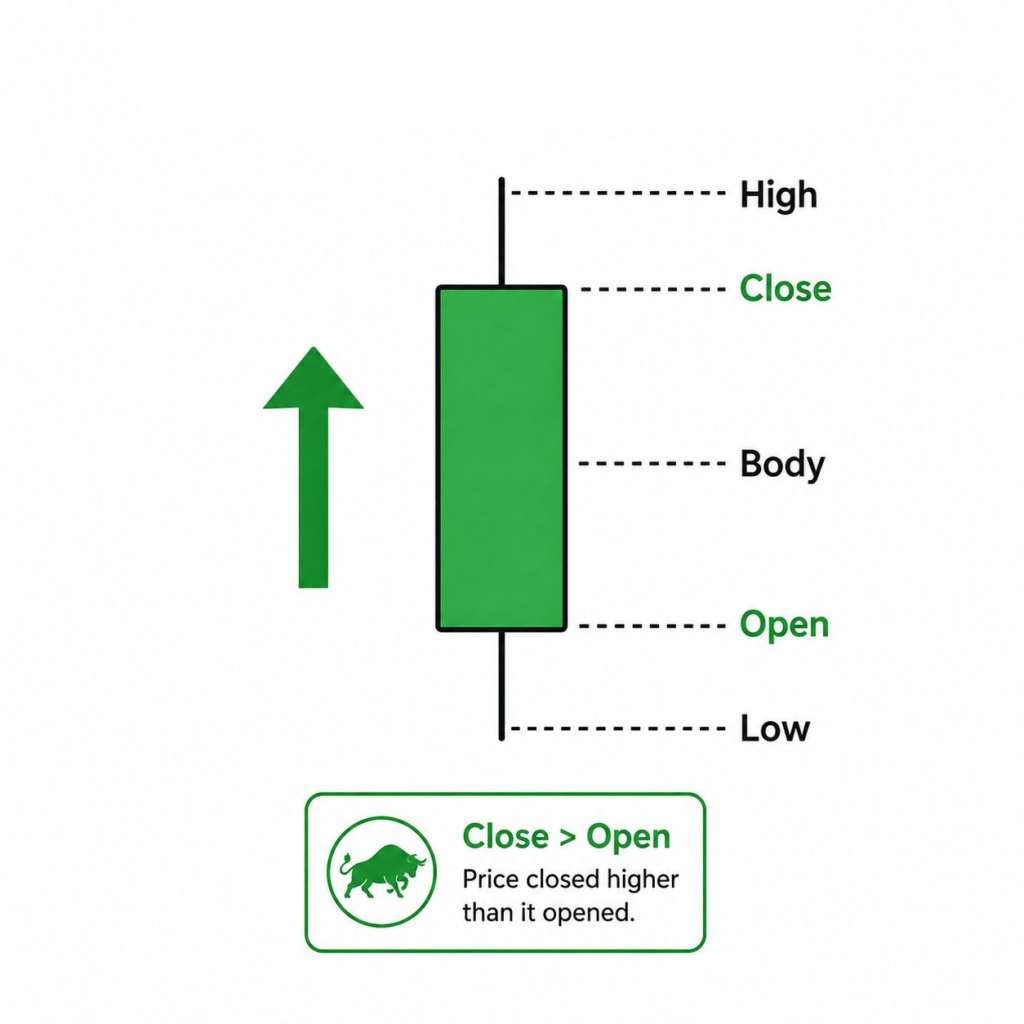
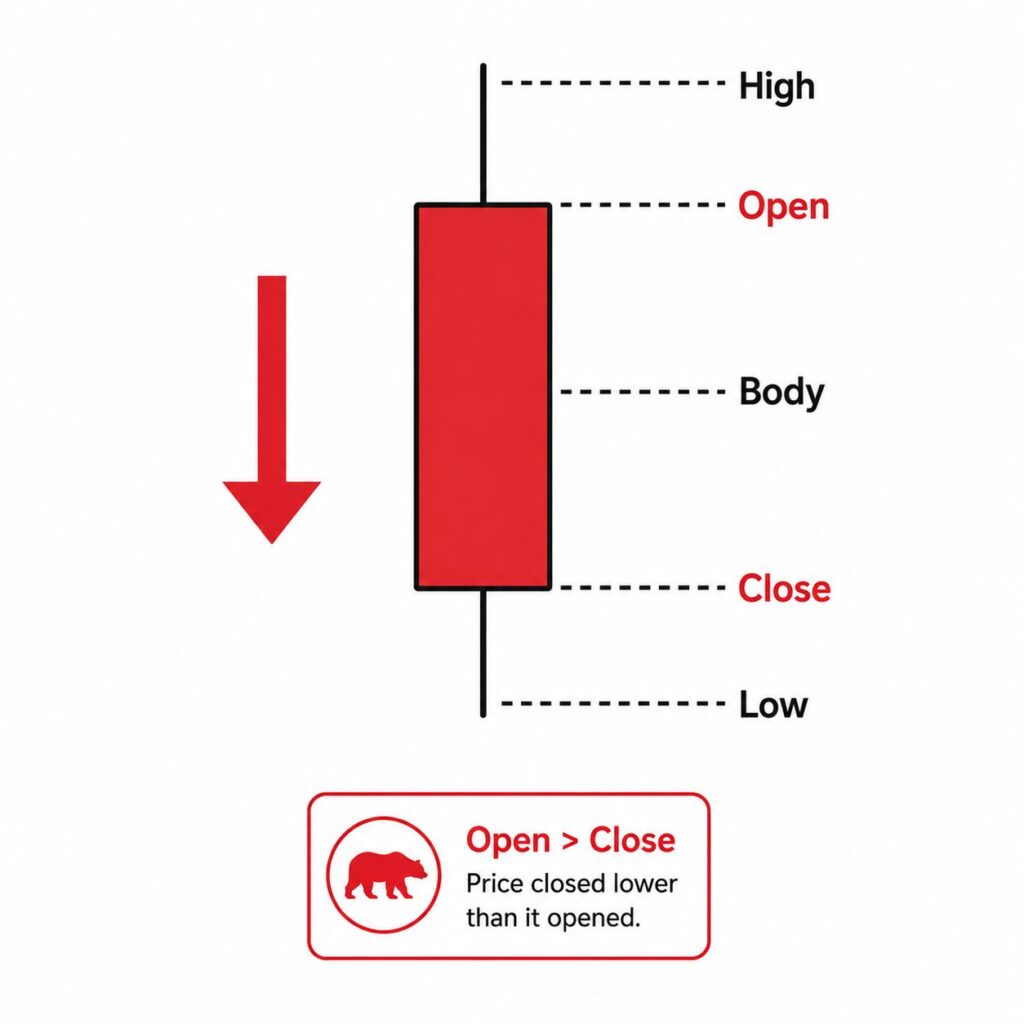
The body is the space between open and close.
- If the closing price is higher than the opening price, the candle is typically green, signifying a bullish sentiment.
- If the open price is higher than the close price, the candle is usually shown in red, indicating bearish sentiment.
2. Shadows (Wicks)
The thin lines extending above and below the body are known as wicks or shadows.
- The upper wick is the maximum price for that period
- The lower wick is the lowest price of that period.
All of these elements combined tell the full story of price action for that particular time period.
Why Candlesticks Are Important
Candlestick charts provide traders with a look at market psychology. They suggest clues to:
- Ask to Buy
- Weak selling
- Market uncertainty.
- Potential trend reversals
- Continuation of existing trends
The candlestick chart is a popular trading tool because it displays more information than a simple line chart.
How Candlestick Time Frames Work
Candlesticks represent a time period depending on the chart setting.
For example:
- 1 minute candle – gives the price movement in one minute.
- 5 minute candle – shows the price movement, in a five minute period.
- 15-minute candle – widely used by intraday traders.
- Daily candle – means one day of trading.
- Candles weekly – 1 week.
- Monthly candle – month
Most of the BTST traders and swing traders use the daily chart whereas intraday traders use lower time frames.
Types of Candlesticks
Bullish Candlestick
When the closing price is higher than the opening price, it forms a bullish candlestick.
It means buyers had more power than sellers during that period.
Example:
Open Price: ₹5000
Last Price 520.00
If the stock closes above where it opened, that forms a bullish candle.
Bearish Candlestick
A bearish candlestick is formed when the closing price is lower than the opening price.
IThat shows sellers had the upper hand.
Sample:
Initial Price: Rs.520
Last price:Rs. 500
The stock closed below the opening price, a bearish candle.e.
Popular Candlestick Patterns Every Beginner Should Know
1. Doji
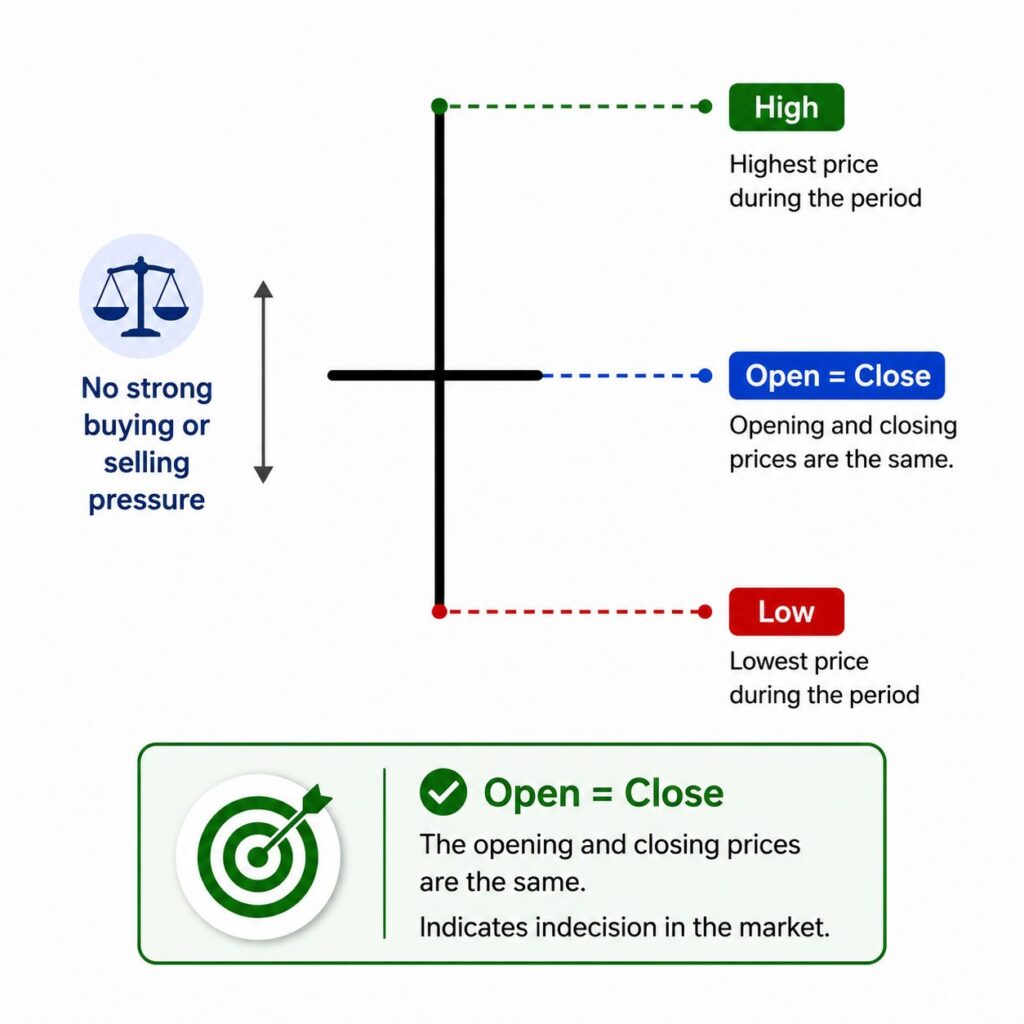
A Doji occurs when the opening and closing prices are almost equal.
It indicates indecision in the market, where neither buyers nor sellers are in control.
Traders often watch for confirmation after a Doji before taking a position.
2. Hammer
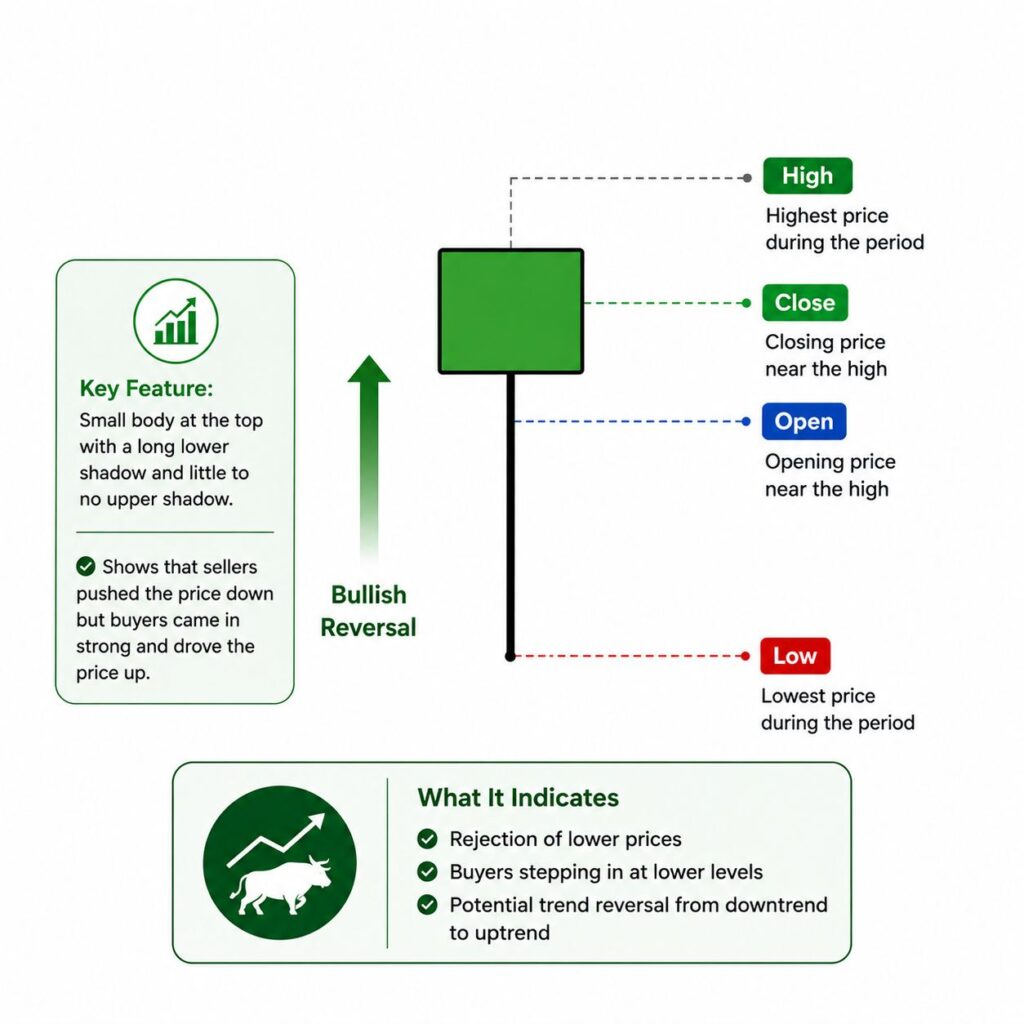
The Hammer is a bullish reversal pattern that appears after a downtrend.
Characteristics include:
- Small body near the top.
- Long lower shadow.
- Little or no upper shadow.
It suggests that buyers have stepped in after strong selling pressure.
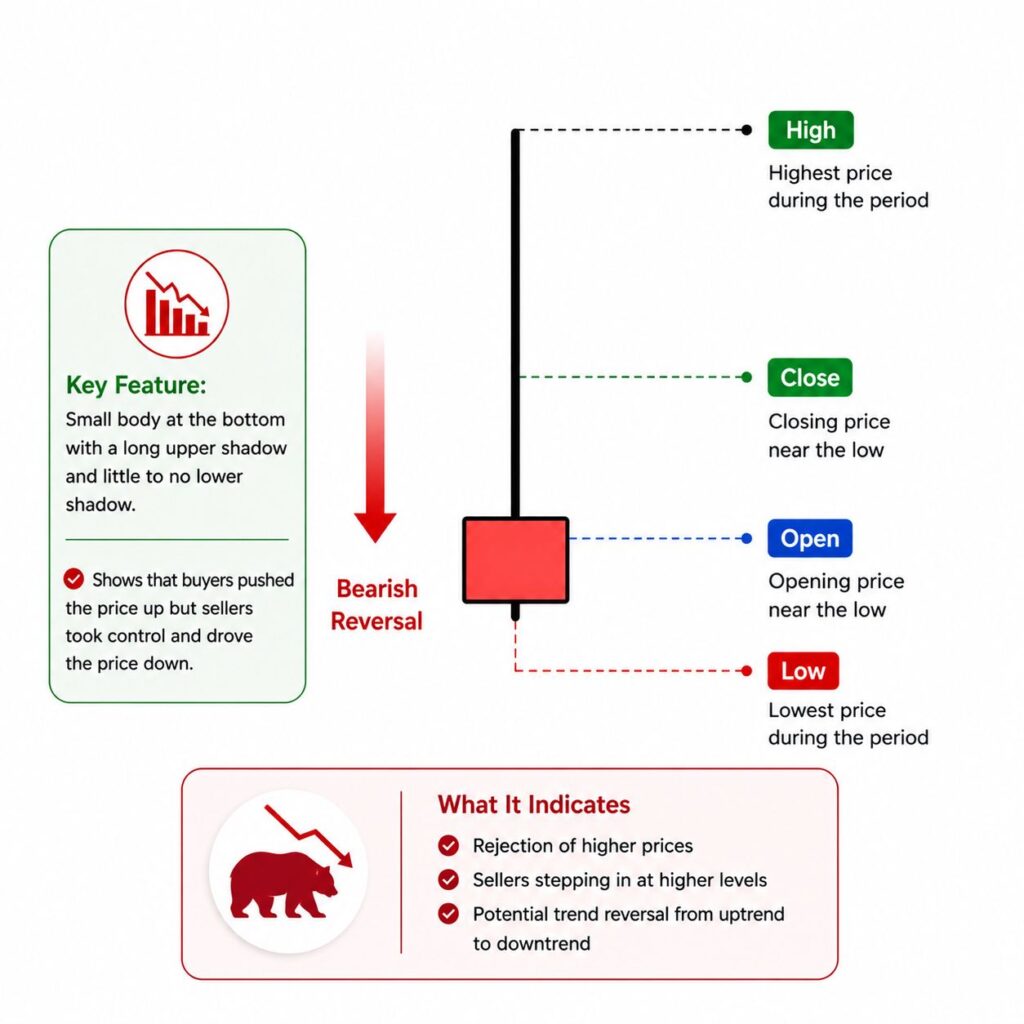
3. Shooting Star
The Shooting Star is a bearish reversal pattern found near the top of an uptrend.
Characteristics include:
- Small body near the bottom.
- Long upper shadow.
- Minimal lower shadow.
It indicates that buyers attempted to push prices higher, but sellers regained control.
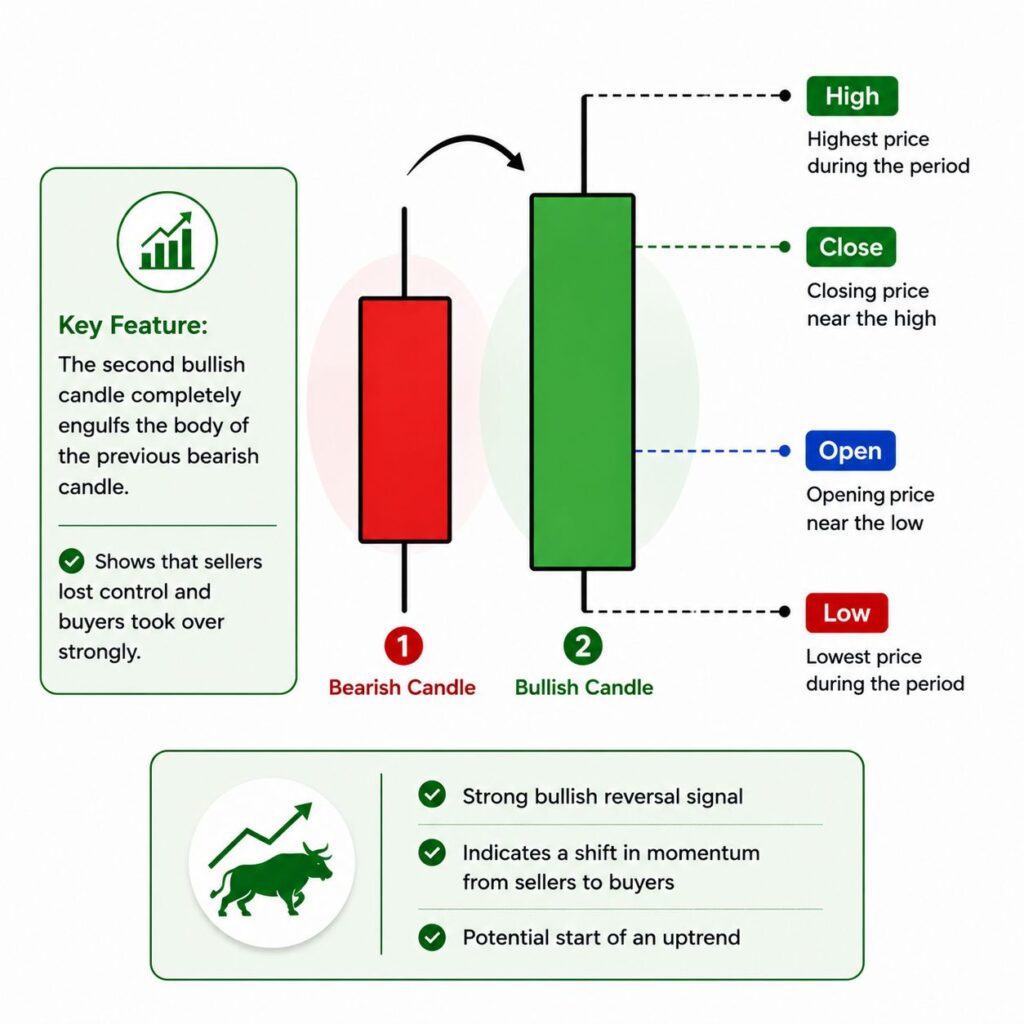
4. Bullish Engulfing Pattern
This pattern occurs when a large bullish candle completely engulfs the previous bearish candle.
It signals a potential upward reversal and growing buying interest.
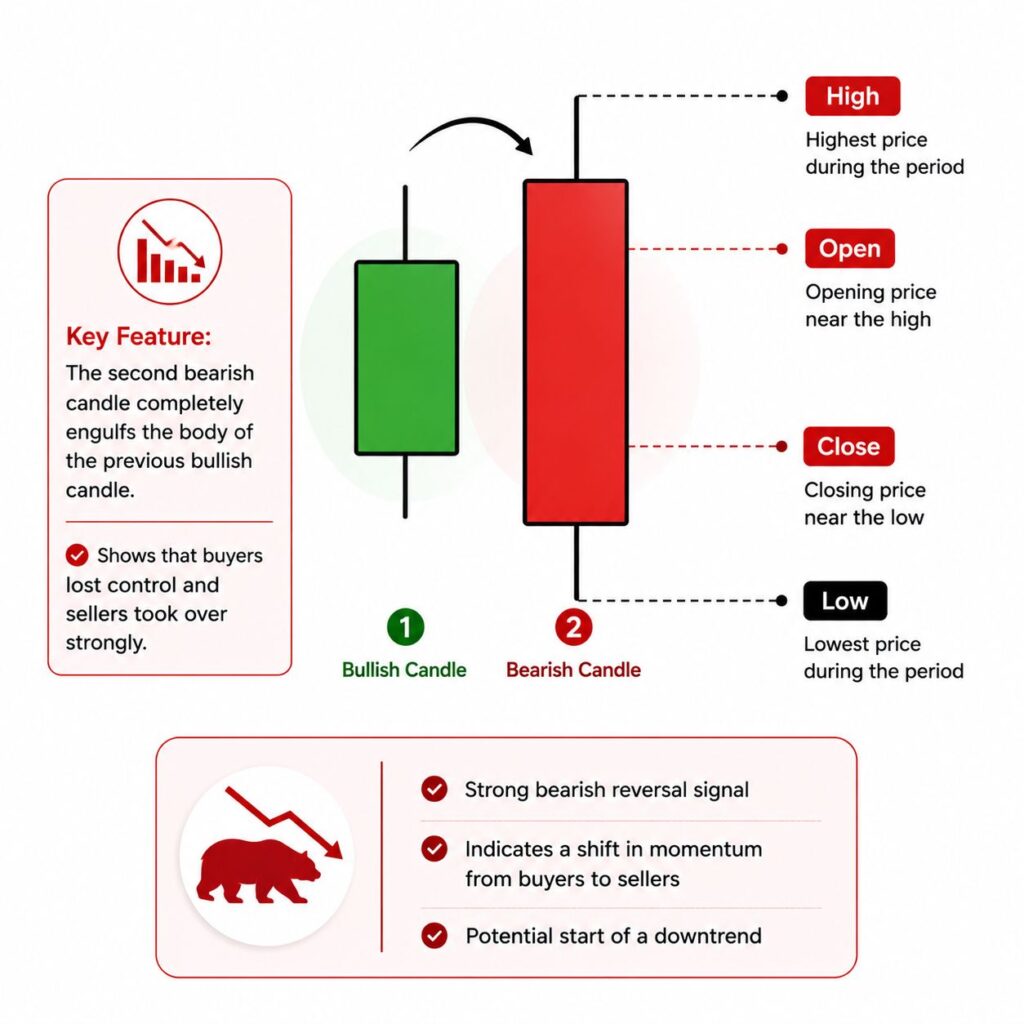
5. Bearish Engulfing Pattern
This pattern forms when a large bearish candle engulfs the previous bullish candle.
It may indicate the beginning of a downward trend.
How Traders Use Candlestick Analysis
Never use candlestick patterns in isolation. Professional traders use them with other tools, such as:
- Support and resistance levels
- Trend lines
- Moving averages
- Volume analysis
- RSI (Relative Strength Index)
- Market structure
For example, a bullish engulfing pattern forming at a strong support level carries more significance than the same pattern appearing randomly.
Advantages of Using Candlestick Charts
Easy to Understand
Candlestick charts visually represent market activity, making them beginner-friendly.
Provides Market Sentiment
They reveal whether buyers or sellers are currently dominating the market.
Identifies Trading Opportunities
Candlestick patterns can help traders spot potential entry and exit points.
Works Across Markets
Candlestick analysis can be applied to stocks, commodities, forex, and cryptocurrencies.
Limitations of Candlestick Analysis
While candlestick charts are powerful tools, they are not foolproof.
Some limitations include:
- Patterns can generate false signals.
- Different traders may interpret patterns differently.
- They work best when combined with other technical indicators.
- Market news and global events can override technical setups.
Therefore, proper risk management remains essential.
Tips for Beginners Learning Candlestick Trading
If you are just starting your trading journey, keep these tips in mind:
Focus on a Few Patterns
Avoid trying to memorize dozens of patterns at once. Begin with:
- Hammer
- Shooting Star
- Doji
- Bullish Engulfing
- Bearish Engulfing
Practice on Historical Charts
Study past charts to understand how patterns behaved in different market conditions.
Use Stop Losses
Never enter a trade without defining your risk.
Maintain a Trading Journal
Document your trades and observations to improve your decision-making over time.
Be Patient
Mastering candlestick analysis requires practice and discipline.
Conclusion
Candlesticks are one of the most valuable tools in technical analysis. They help traders understand price behavior, identify potential trend reversals, and gain insights into market psychology. However, successful trading involves much more than recognizing patterns on a chart.
Beginners should focus on learning the fundamentals, understanding risk management, and combining candlestick analysis with other technical tools. With consistent practice and the right approach, candlestick charts can become a powerful part of your trading strategy.
Whether you are interested in intraday trading, swing trading, or BTST trading, developing a strong understanding of candlesticks can significantly improve your ability to analyze the market and make informed trading decisions.
Remember: Candlestick patterns indicate possibilities, not guarantees. Always trade with a well-defined plan and proper risk management.